
 Image 1 of 5
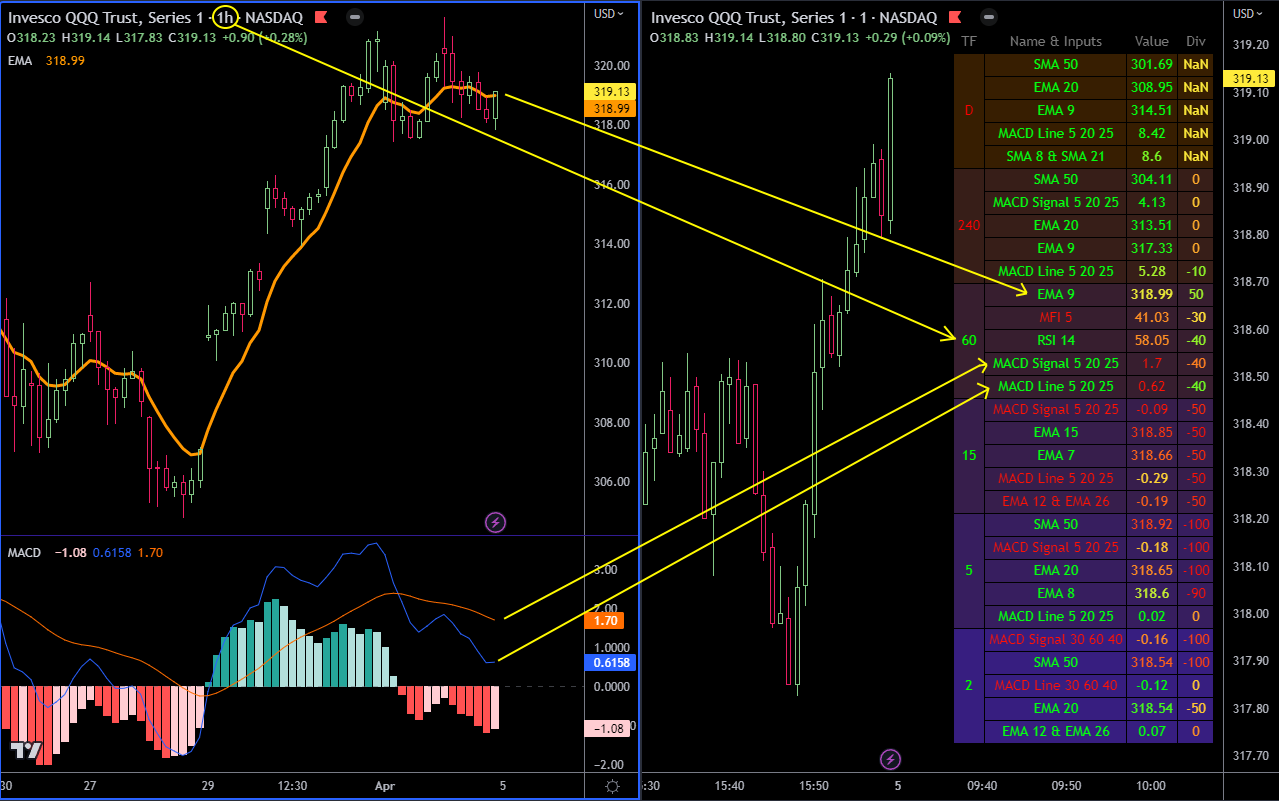 Image 2 of 5
 Image 3 of 5
 Image 4 of 5
 Image 5 of 5
The Indicator Scorecard displays a table showing your favourite indicators, their values, trajectories, relative positions and indicator divergence percentages across your choice of timeframes.
126+ data points in one compact table
View the values of indicators from multiple timeframes on a single chart table
Customizable timeframes, indicators and, indicator input values
View the angle of the slope of the indicators via color, either as a smooth three-colour relative gradient (up/down/flat) or a simple two-colour binary (up/down)
View via colour when the indicator value is above or below either the close (for MA & EMA etc) or zero (for MACD) or 50 (for Stochastics, RSI & MFI)
View indicator divergence with price over a customizable lookback range as a percentile where 100 is 100% positively divergent and -100 is 100% negatively divergent
Alerted when moving averages are crossing over or under another
Fully customizable colour schemes
Indicators currently supported:
Moving Average (MA)
Exponential Moving Average (EMA)
Relative Strength Index (RSI)
Money Flow Index (MFI)
Moving Average Convergence Divergence (MACD)
Average True Range (ATR)
Moving Average Cross (MA Cross)
Exponential Moving Average Cross (EMA Cross)
Stochastic %K and %D (Stoch)
Feel free to contact us to request additional indicators
Please note that this table must be run on a timeframe no larger than the shortest timeframe used in the table in order to get accurate data. For perfectly accurate colouring, the timeframes used in the table must be divisible by the chart’s timeframe. For this reason, it is recommended to use this table on a 1 minute chart for day trading.
After purchase we will invite you to the script in TradingView within 24 hours, but will try to be as fast as possible. You will be notified by email and within TradingView in the notifications tab when you have access to the script.