Weighted AD type is chosen at checkout. S&P, NDX, DAX, ASX, NIFTY, Bank NIFTY, Hang Seng, CSI, FTSE and AEX are available.
The latest must have TradingView indicator to enhance your trading experience.
This script uses the total advances and declines of the 11 S&P subsectors to plot an unweighted line and a weighted histogram. The weighted histogram plots the total subsector A/D as according to their respective weighting in the S&P. This gives the trader a massive edge in discerning the strength and breadth of moves throughout the day.
Plots a weighted cumulative S&P A/D line against an unweighted one
Plots green and red circles when the indicator diverges with any chart of your choice
See when heavily weighted sectors are leading or lagging
Adds a vital layer to internal divergences and confirmations
Customizable plotting styles (histogram, dots, lines etc.)
Daily and weekly timeframe divergences
Easily update sector weighting
Bare in mind that any Weighted AD can handle a maximum of 40 symbols and so large indicies which do not have subsector representation via tradable symbols may not be fully representative of their constituents.
User Notes - How to use the Weighted A/D
Available for Thinkorswim at Shadowtrader.net
After purchase we will invite you to the script in TradingView within 24 hours, but will try to be as fast as possible. You will be notified within TradingView in the notifications tab when you have access to the script.

 Image 1 of 7
 Image 2 of 7
 Image 3 of 7
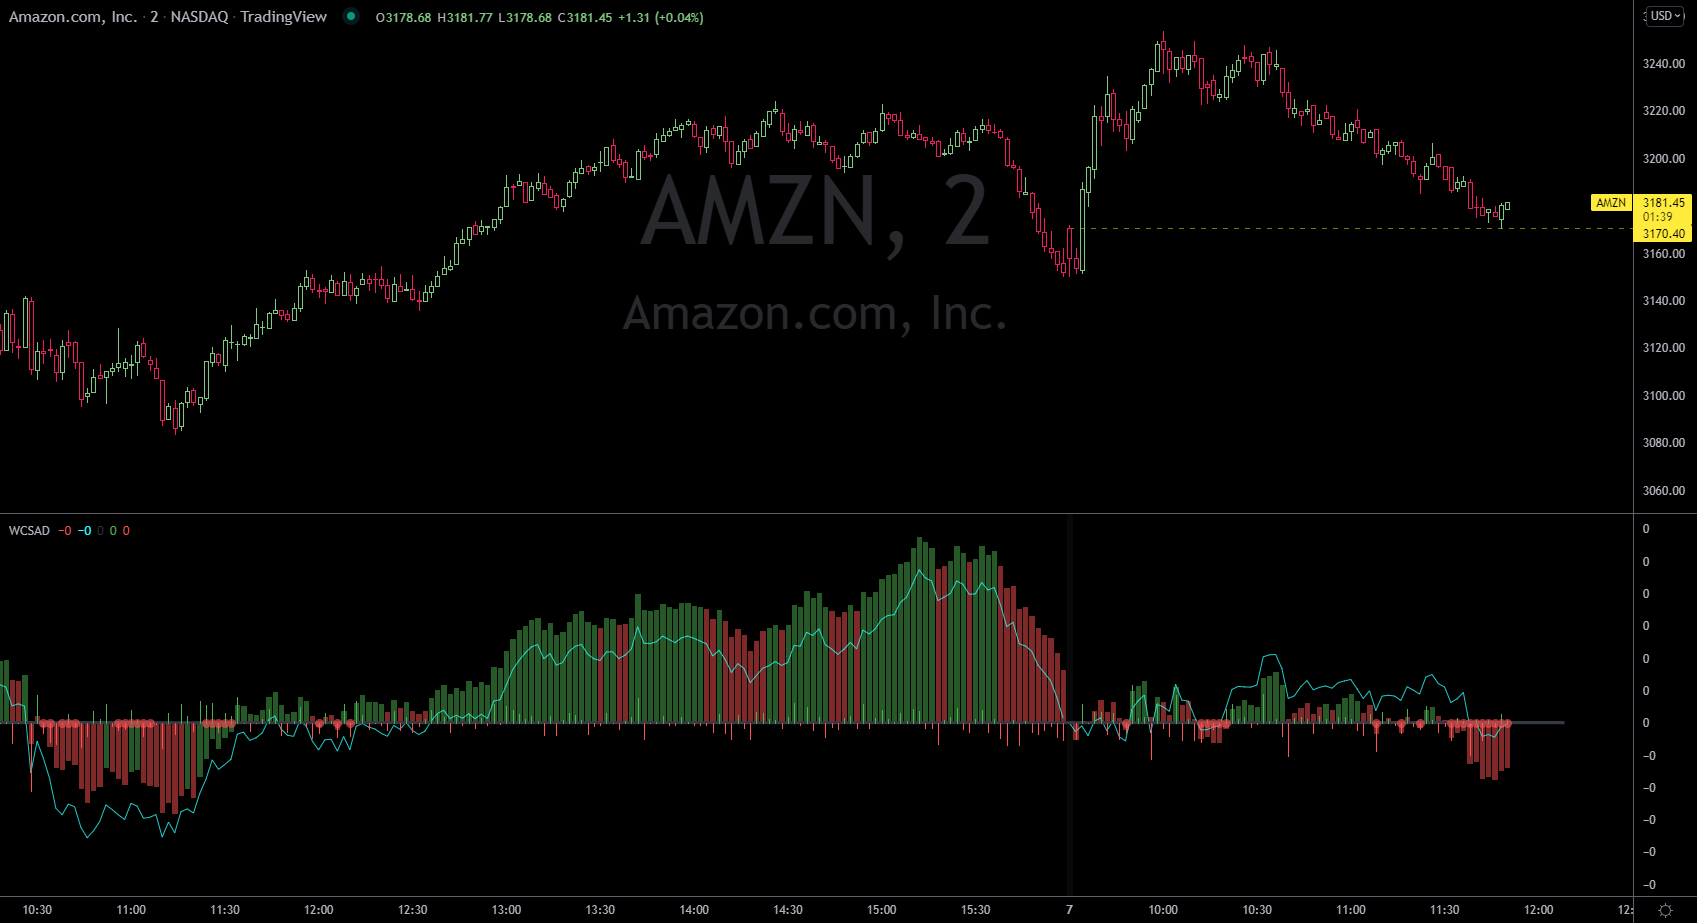 Image 4 of 7
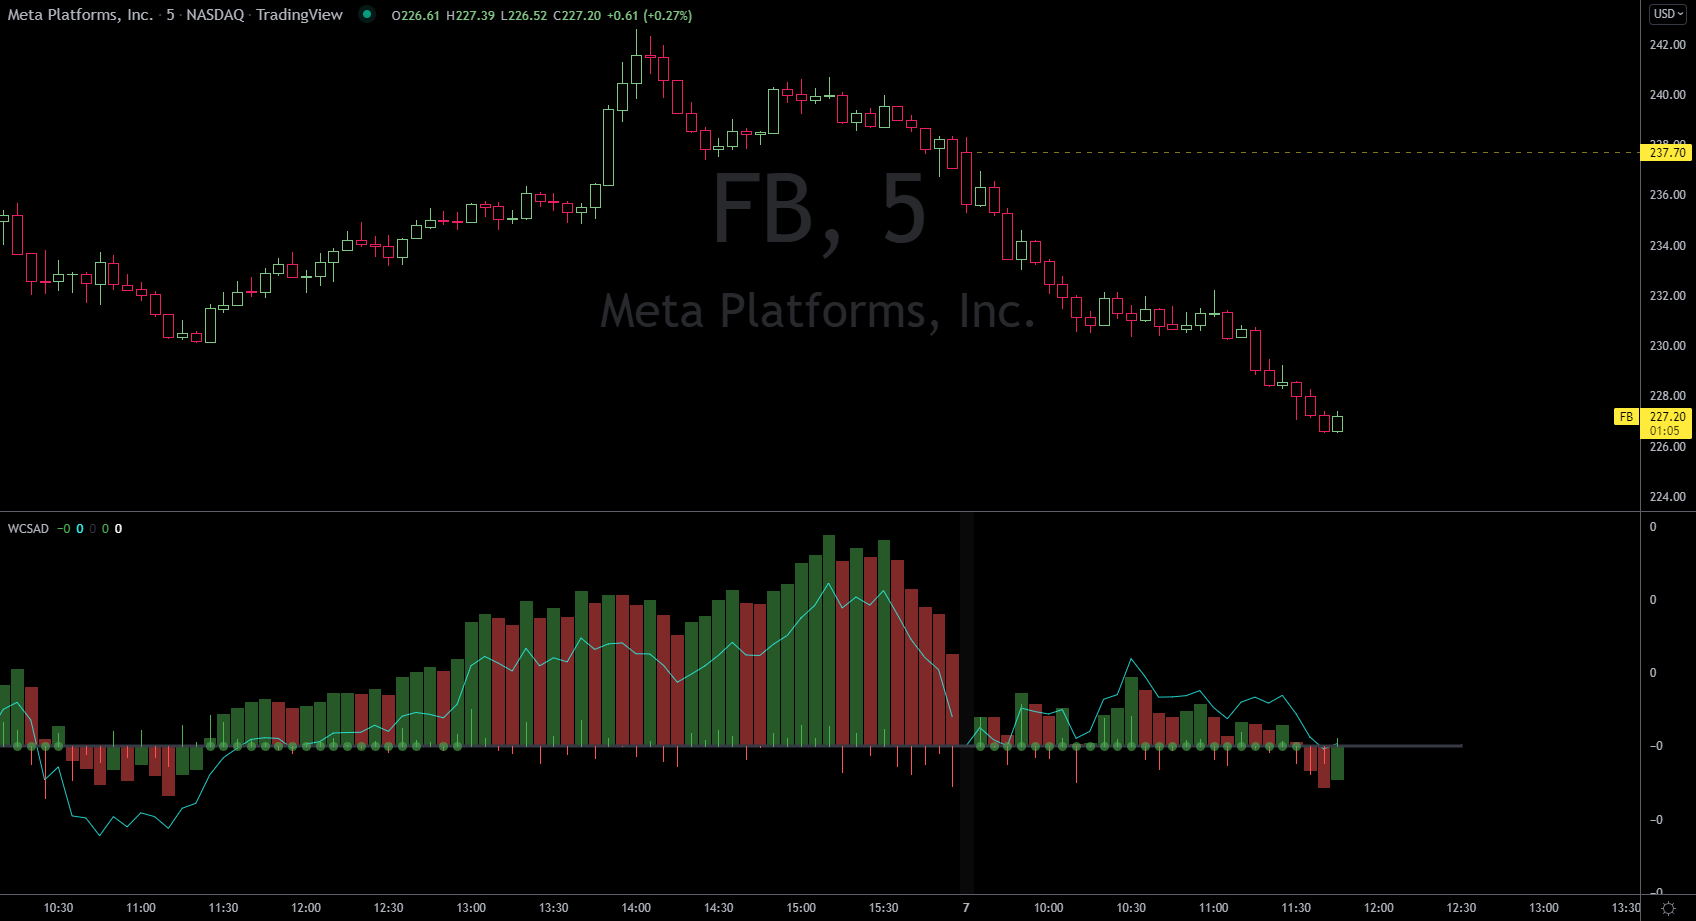 Image 5 of 7
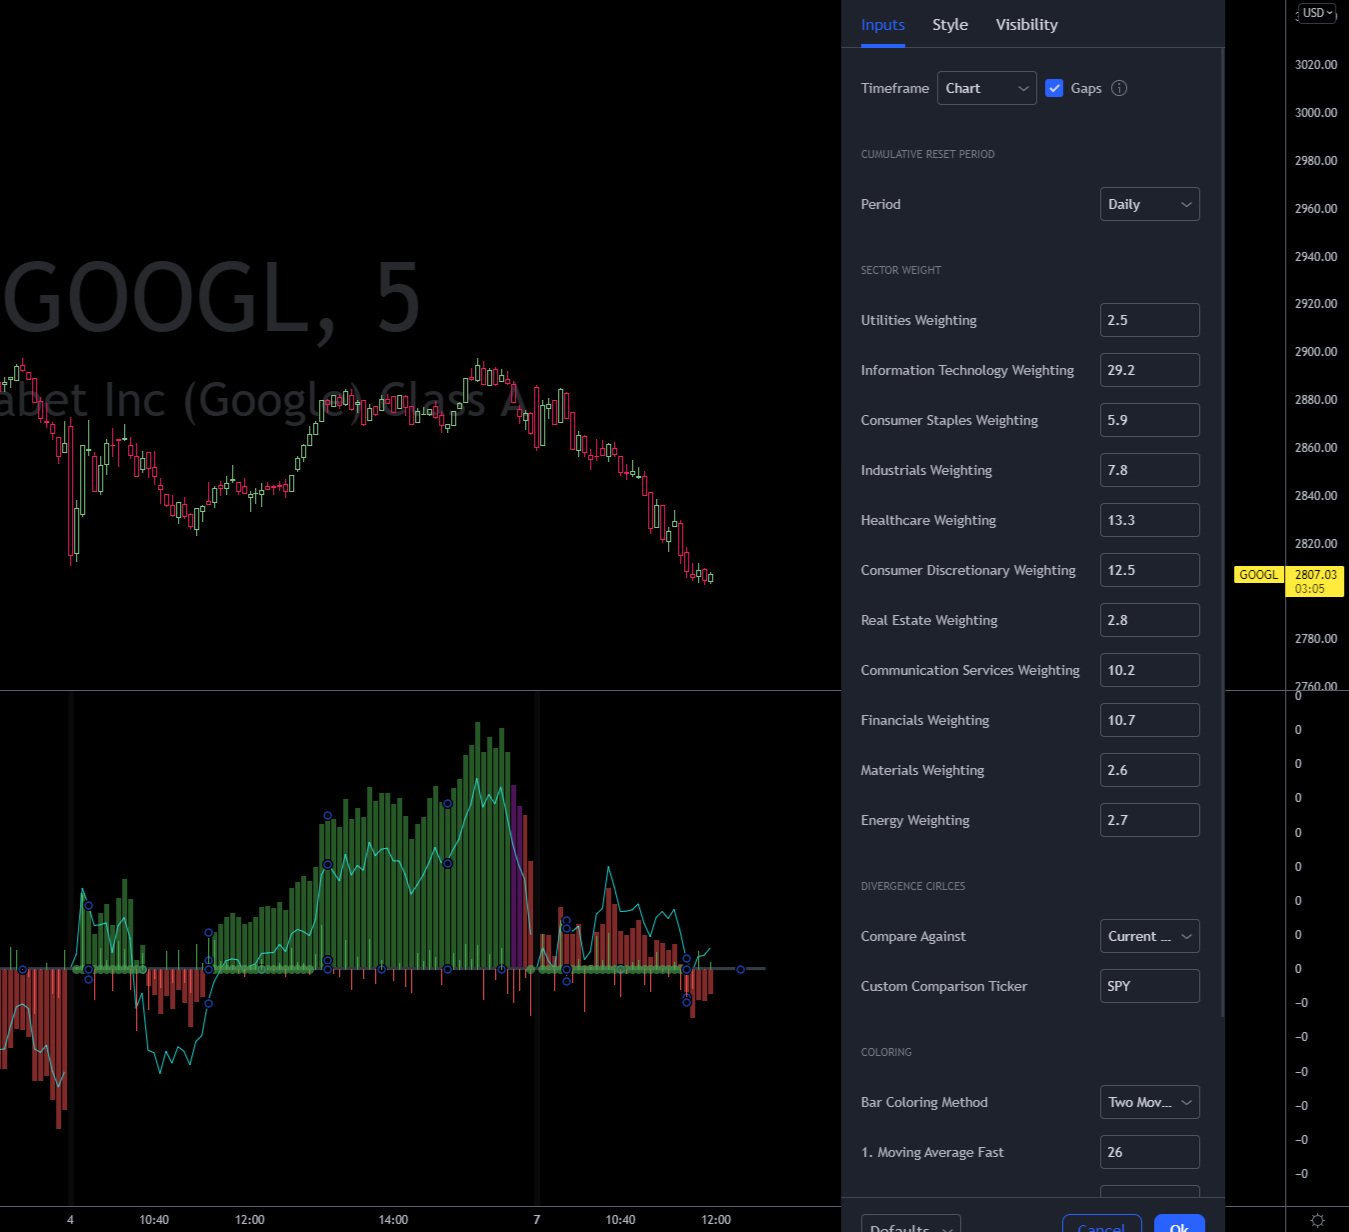 Image 6 of 7
 Image 7 of 7